Electrophoresis and its application used in medicine

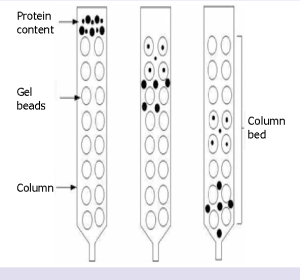
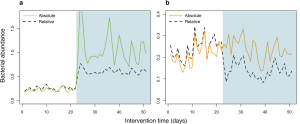
Electrophoresis or cataphoresis is the same as chromatography in which charged molecules (such as nucleic acids and proteins) are placed in an electric field and separated based on size. In the diagnosis of a broad range of diseases, like gastrointestinal disorders, immunodeficiency, and inflammatory diseases, the results of serum protein electrophoresis are appropriate.

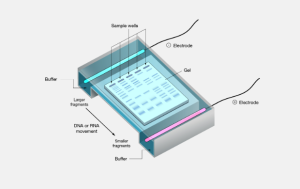
Figure 1. Schematic view of electrophoresis

Some electrophoresis types used in clinic

۱- Polyacrylamide gel electrophoresis (PAGE) → is used for the quantification, comparison, and description of proteins, peptides and nucleic acids with low molecular weight in serum or urine.

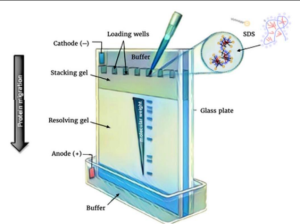
Figure 2. Polyacrylamide Gel Electrophoresis (PAGE)

۲- Agarose gel electrophoresis (AE) → is used for detection of protein abnormalities in various biological fluids, analysis of serum proteins, hemoglobin variants, lipoprotein fractions, and separation of DNA or RNA fragments of different lengths.

Figure 3. Agarose Gel Electrophoresis

۳- pulsed-field gel electrophoresis (PFGE) → is used for separation of large DNA molecules belonging to many living species including bacteria, viruses and mammals.

Figure 4. Pulsed-Field Gel Electrophoresis

۴- Isoelectric focusing (IEF) → is often used to demonstrate batch consistency as part of the quality control testing of therapeutic biological products.

Figure 5. Isoelectric focusing

۵- Two dimensional electrophoresis (2-DE) → is a powerful tool for separating complex mixtures of proteins from tissues, cells, or other biological samples.

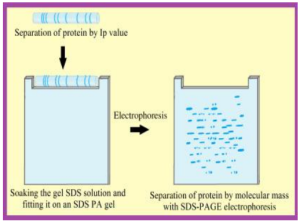
Figure 6. Two-Dimensional (2DE) gel electrophoresis

۶- Capillary electrophoresis (CE) → is used for pharmaceutical discoveries (especially in the case of anti-cancer drugs) and genetic analyses.

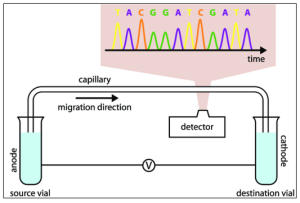
Figure 7. Capillary Electrophoresis


۷- Microchip electrophoresis (ME) → is widely used in mutation analysis, genotyping, immunological tests and small molecule detection and has been very successful in diagnosing of diabetes, pancreatic disorder, cancer, immune and genetic disorders, cardiovascular and infectious diseases.

Figure 8. Microchip Electrophoresis

۸- Immune electrophoresis → is widely used to identify protein changes in inflammation, liver and kidney diseases.

۹- Immunofixation electrophoresis → is a golden standard method for diagnosis and follow-up of multiple myeloma and paraproteinemia, genetic studies, and clinical trials.

Figure 9. Immunofixation electrophoresis (IFE) on serum from 4

patients


۱۰- Hemoglobin electrophoresis → Thalassemia, and abnormal hemoglobins variants, can be identified.

۱۱- Automatic Electrophoresis System → can be used for the completion of the Human Genome Project, the detection of conformation polymorphism in genetic samples, and protein analysis with High efficiency.

References

  • Fesmire, J.D., (2019). A Brief Review of Other Notable Electrophoretic Methods. In Electrophoretic Separation of Proteins (pp:495-499). Humana Press, New York, NY.
  • Gowenlock, A.H., McMurray, J.R., and McLauchlan, D.M., (1987). Separative Procedures, Electrophoresis. In: Varley’s Practical Clinical Biochemistry. Heinman Medical Books, London. 69-81.
  • Judd, R.C., (1996). SDS-polyacrylamide Gel Electrophoresis of Peptides. In The Protein Protocols Handbook (pp:101-107).
  • Hames, B.D., (1998). Gel Electrophoresis of Proteins A Practical Approach Third Edition. Edited by School of Biochemistry and Molecular Biology.
  • Giot, J.F., (2010). Agarose gel Electorphoresis–applications in Clinical Chemistry. JMB., 29:9–۱۴.
  • Nedelcu, S. and Watson, J.H.P., (2004). Size Separation of DNA Molecules by Pulsed Electric Field Dielectrophoresis. J. Phys. D: Appl. Phys., 37:2197–۲۲۰۴.
  • McEllistrem, M.C., Stout, J.E., and Harrison, L.H. (2000). Simplifield Protocol for Pulsed-Field Gel Electrophoresis Analysis of Streptococcus pneumoniae. Journal of Clinical Microbiology., 38:351-353.
  • Magdeldin, S., Enany, S., Yoshida, Y., Xu, B., Zhang, Y., Zureena, Z., and Yamamoto, T., (2014). Basics and Recent Advances of Two Dimensional-Polyacrylamide Gel Electrophoresis. Clinical proteomics, 11(1):16.
  • Tristezza, M., Gerardi, C., Logrieco, A., and Grieco, F., (2009). An Optimized Protocol for the production of interdelta markers in Saccharomyces Cerevisiae By Using Capillary Electrophoresis. Journal of Microbiological Methods., 78:286–۹۱.
  • Wuethrich, A. and Quirino, J.P., (2019). Decade of Microchip Electrophoresis for Clinical Diagnostics – A review of 2008-2017. Analytica Chimica Acta., 1045:42-66.
  • Michels, D.A., Hu, S., Schoenherr, R.M., Eggertson, M.J., and Dovichi, N.J., (2002). Fully Automated Two-dimensional Capillary Electrophoresis for High Sensitivity Protein Analysis. Mol Cell Proteomics., 1:69-74.

prepared by: Parvin Zarei

The basics of mass spectrometry

Mass spectrometry (MS) is a key tool for identifying proteins with low concentration in complex mixtures, which is widely used due to its speed and high sensitivity. MS, along with other separation techniques such as HPLC and capillary electrophoresis, play an important role in identifying of biomarkers in biological fluids and due to wide its utility in various analyses has become a practical and routinely tool in many laboratories.

In this technique, the mass-to-charge (m/z) ratio is determined. A plot of ion abundance against m/z, forms a mass spectrum and is provided in terms of Daltons (Da) per unit charge. The analysis of gas-phase ions provides any information about a mass spectrometer. In MS, the ability to distinguish between two nearby peaks (resolution) is the key factor related to the precision of the measurement.

The MS composed of three main components, including an ionization source, mass analyzer, and a detector (Figure 1).

Mass spectrometers present information such as m/z ratios, abundances of the elements in a sample, and structural information, like the linkage of atoms in a molecule.

Basic components of a typical mass spectrometer

Figure 1: Basic components of a typical mass spectrometer

Ionization source

One of the important reaction in MS is analyzed in the vacuum that converts components into gas ions. Ionization processes occur in two separate phases: at first the sample vaporized and at second it is ionized. Two main methods of ionization are electro spray ionization (ESI) and matrix-assisted laser desorption/ionization (MALDI).

Electro spray ionization (ESI)

In Electro spray ionization (ESI) with passing a solution sample by a capillary with diameter < 250 µm, at voltages between +500 and +4,500 V, Ions are generated. Also, the main source of supply for related ions in ESI, is protonation/deprotonation. In the figure below, which is an example of the mass spectrum of cytochrome c, each separate peak represents a certain mass, which increases the accuracy of the measurement. In this spectrum, due to altering degrees of protonation and different charge states, multiplex peaks have been created.

Despite all advantages, there are two significant limitations to ESI, including 1) consuming samples and wasting a part of a sample and 2) its susceptibility to ion suppression effects when salt concentrations are high.

Matrix-assisted laser desorption/ionization (MALDI)

In matrix-assisted laser desorption/ionization (MALDI) ions are yielded by the pulsed-laser radiance of a sample. And so on, the samples are crystallized through a solid matrix that absorbs the laser.

Finally, the samples in the form of a combination with the matrix that happens on a probe in the vacuum system and, after irradiation, are directed to the mass analyzer.

Among the positive features of this analyzer, the following can be mentioned: the loss of small amounts of samples, high sensitivity, providing molecular weight data of one or more analytes, and, in the end, high tolerance to salts and buffers.

Electrospray ionization (ESI) mass spectrum of cytochrome c

Figure 2,3: Electrospray ionization (ESI) mass spectrum of cytochrome c, Matrix-assisted laser desorption/ionization (MALDI) mass spectrum of cytochrome c

Only a single peak is observed for the analyte because ionization in MALDI generally occurs by the addition of a single proton. The following are the limitations of MALDI:

  • Observe a large degree of chemical noise
  • Difficulty analyzing low molecular weight samples

mass analyzer

There are five basic types of mass analyzers into two categories:

  • Beam analyzers (The ions move from the ion source in the form of a beam and transit to the detector through the analyzing field)

and

  • Trapping analyzers (the ions after being formed in the analyzing field are captured in it, or injected from another external supply)

The type of beam analyzers

Time-of-flight (TOF)

The time-of-flight (TOF) mass spectrometer is the simplest and the most commonly used mass analyzer for MALDI experiments. The mass range is unlimited in TOF. In the TOF analyzer, ions separated based on their velocity. As a result, the lower m/z ions reach higher velocities and vice versa. Therefore, can be said that ion velocities are related to the square root of m/z inversely. Eventually, by measuring the time that ions reach the detector, their m/z can be determined.

Sector analyzer

A sector analyzer maybe containing a magnetic sector or an electric sector. By the electric sector, ions accelerated from the ionization source and curved. Ions pursue a current path through a magnetic sector and can be distributed based on their m/z ratio.

Quadrupole

In this analyzer, the correct magnitude of the radio frequency and straight voltages used to the rods allows to ions of a single m/z to retain stable paths from the ion source to the detector, but ions with several m/z values are disabled to retain stable paths.

Pictorial diagrams of the common beam mass analyzers viewed from above.

Figure 4. Pictorial diagrams of the common beam mass analyzers viewed from above.

Trapping mass analyzer

In trapping mass analyzer, ions retain a stable path. At the same time that ions fluctuate near the top and down cubic metal plates of the trapping cell, an alternating current is induced by them that can be measured and associated with their m/z ratio.

Pictorial diagrams of the common trapping mass analyzer

Figure 5. Pictorial diagrams of the common trapping mass analyzer

Future prospects

Complex mixtures analysis can be easier conducted by the development of ionization techniques such as ESI and MALDI.  The development of MS technique can be very useful in all fields of omics and other aspects, such as protein identification, post-translation modification, peptide sequencing, and detection of protein-protein interactions. As a result, MS technique play a key role in science in the future.

References

  • Cheng, X. & Hochlowski, J. Current application of mass spectrometry to combinatorial chemistry. Anal. Chem. 74, 2679–۲۶۹۰ (۲۰۰۲).
  • Triolo, A., Altamura, M., Cardinali, F., Sisto, A. & Maggi, C. A. Mass spectrometry and combinatorial chemistry: a short outline. J. Mass Spectrom. 36, 1249–۱۲۵۹ (۲۰۰۱).
  • Kassel, D. B. Combinatorial chemistry and mass spectrometry in the 21st century drug discovery laboratory. Chem. Rev. 101, 255–۲۶۷ (۲۰۰۱).
  • Yamashita, M. & Fenn, J. B. Electrospray ion source. another variation of the free-jet theme. J. Phys. Chem. 88, 4451–۴۴۵۹ (۱۹۸۴). The initial publication in the development of electrospray as a useful ionization technique for mass spectrometry.
  • Karas, M., Bachmann, D., Bahr, U. & Hillenkamp, F. Matrixassisted ultraviolet laser desorption of non-volatile compounds. Int. J. Mass Spectrom. Ion Processes 78, 53–۶۸ (۱۹۸۷). Seminal publication describing the use of a matrix to enhance the ionization efficiency of non-volatile compounds — this method of laser/desorption ionization is the most commonly used today.
  • Horning, E. C., Horning, M. G., Carroll, D. I., Dzidic, I. & Stillwell, R. N. New Picogram detection system based on a mass spectrometer with an external ionization source at atmospheric pressure. Anal. Chem. 45, 936–۹۴۳ (۱۹۷۳).
  • Smith, R. D., Cheng, X., Bruce, J. E., Hofstadler, S. A. & Anderson, G. A. Trapping, detection, and reaction of very large single molecular ions by mass spectrometry. Nature 369, 137–۱۳۹ (۱۹۹۴).
  • Lu, Y., Zhou, F., Shui, W., Bian, L., Guo, Y. & Yang, P. Pulsed Electrospray for mass spectrometry. Anal. Chem. 73, 4748–۴۷۵۳ (۲۰۰۱).
  • Fenselau, C. & Demirev, P. A. Characterization of intact microorganisms by MALDI mass spectrometry. Mass Spectrom. Rev. 20, 157–۱۷۱ (۲۰۰۱).
  • Weickhardt, C., Moritz, F. & Grotemeyer, J. Time-of-flight mass spectrometry: state-of the-art in chemical analysis and molecular science. Mass Spectrom. Rev. 15, 139–۱۶۲ (۱۹۹۶).
  • Stafford, G. C. J., Kelley, P. E., Syka, J. E. P., Reynolds, W. E. & Todd, J. F. J. Recent improvements in and analytical applications of advanced ion trap technology. Int. J. Mass Spectrom. Ion Processes 60, 85–۹۸ (۱۹۸۴).
  • Schwartz, J. C., Syka, J. E. P. & Jardine, I. High resolution on a quadrupole ion trap mass spectrometer. J. Am. Soc. Mass Spectrom. 2, 198–۲۰۴ (۱۹۹۱).
  • Tecklenburg, R. E., Miller, M. N. & Russell, D. H. Laser ion beam photodissociation studies of model amino acids and peptides. J. Am. Chem. Soc. 111, 1161–۱۱۷۱ (۱۹۸۹).
  • Aebersold, R. & Goodlett, D. R. Mass spectrometry in proteomics. Chem. Rev. 101, 269–۲۹۵ (۲۰۰۱).
  • Glish, Gary L Vachet, Richard W. The basics of mass spectrometry in the twenty-first century. Nature reviews drug discovery. 2, 140-150 (2003).

Analysis of meta-genomic data based on 16S rRNA sequencing

In recent years, the rapid decline in the cost of next-generation sequencing (NGS) and increasing the length of readable sequences have led to the development of two shotgun sequencing and 16S rRNA gene profiling approaches to describe the structure of microbial communities. These approaches could become standard tools for scientists and many laboratories in the field of microbial ecology in the near future. Then shotgun sequencing, 16S rRNA sequencing is more economical. Therefore it is frequently used for studies with large sample sizes or time series, however, it cannot give insight into the metabolic structure of microbial communities.

Figure 1. Different stages of metagenome projects. Metagenomics – a guide from sampling to data analysis; Torsten Thomas et al. 2012.

The use of 16S rRNA sequencing back to the 1980s, when a new standard for identifying bacteria was first developed. It is then discovered that the phylogenetic relationships of bacteria and all biological organisms could be determined by comparing the stable part of the genetic code. In bacteria, these genetic regions included the genes encoding the 16S, the 5S, the 23S, and the regions between these genes. Today, the 16S rRNA gene is mostly used in bacteria for taxonomic targets. The 16S rRNA gene is a vital part of cell function, a target for antimicrobial agents, and composed of conserved and 9 highly variable regions that have different position, length, and taxonomic differentiation. The approximate length of the 16S rRNA gene is about 1550 bp. Comparison of 16S gene sequences in all major phyla of bacteria makes it possible to differentiate between them at the genus level. In addition, differences in the hypervariable region of ribosomal RNA genes are ideal for phylogenetic studies. The hypervariable region 4 (V4) amongst the short regions (<300 bp), is usually the most usable. 16S rRNA sequencing is an amplicon-based and vigorous tool that is widely used for metagenomic studies. The identification of microbial communities based on phenotypic characteristics is not as accurate as genotypic identification methods. Rarely isolated and poorly described strains, novel pathogens, mycobacteria and no cultured bacteria can be better identify by 16S rRNA gene analysis. This feature can have a significant impact on patient identification and care and also led to improved clinical results and provide exactly grouped organisms for more studies. 16S rRNA gene sequencing is currently the most accurate method for identifying microbial communities in various biological samples. One of the most important applications of the 16S rRNA sequencing method is the identification of unknown organisms based on previous knowledge and it can be said that it is the best choice in this field.

Despite all these advantages, there are problems such as inaccuracy of sequences in some databases, the proliferation of species names based on minimal phenotypic and genetic differences, microheterogeneity in 16S rRNA sequences within a species, and finally, lack of quantitative definition of genus or species based on 16S rRNA data. The most important challenge is the extraction of biochemical signaling pathways from 16S rRNA data that can be used in smaller clinical laboratories.

Necessity of 16S rRNA databases

In general, the existence of databases with accurate biochemical and morphological descriptions of strains is essential for the phenotypic identification of microorganisms. In parallel, in order to accurately identify the 16S rRNA gene sequences of microorganisms, it is necessary to have databases containing a collection of exact sequences with appropriate names with these sequences and exact sequences for isolated types. databases such as GenBank (http://www.ncbi.nlm.nih.gov/), MicroSeq, the Ribosomal Database Project (RDP-II) (http://rdp.cme.msu.edu/html/), Smart Gene IDNS (http://www.smartgene.ch), the Ribosomal Database Project European Molecular Biology Laboratory (http://www.ebi.ac.uk/embl/), and Ribosomal Differentiation of Medical Microorganisms (RIDOM) (http://www.ridom.com/) are examples of associated databases.

Figure2. Universal phylogenetic tree based on the 16S rRNA gene sequence comparisons. Pace, N. A molecular view of microbial diversity and the biosphere. Science276:734-740. 1997.

References

  • A comprehensive benchmarking study of protocols and sequencing platforms for 16S rRNA community profiling.
  • Community genomic and proteomic analyses of chemoautotrophic iron-oxidizing “Leptospirillum rubarum” (Group II) and “ Leptospirillum ferrodiazotrophum” (Group III) bacteria in acid mine drainage biofilms.
  • Metagenomics – a guide from sampling to data analysis.
  • Tax4Fun: predicting functional profiles from metagenomic 16S rRNA data.
  • Impact of 16S rRNA Gene Sequence Analysis for Identification of Bacteria on Clinical Microbiology and Infectious Diseases
  • Bottger, E. C.1989. Rapid determination of bacterial ribosomal RNA sequences by direct sequencing of enzymatically amplified DNA. FEMS Microbiol. Lett.65:171-176.
  • Garrity, G. M., and J. G. Holt.2001. The road map to the manual, p. 119-166. In G. M. Garrity (ed), Bergey’s manual of systematic bacteriology. Springer-Verlag, New York, N.Y.
  • Harmsen, D., and H. Karch.2004. 16S rDNA for diagnosing pathogens: a living tree. ASM News70:19-24.
  • Kolbert, C. P. and D. H. Persing.1999. Ribosomal DNA sequencing as a tool for identification of bacterial pathogens. Curr. Opin. Microbiol.2:299-305.
  • Tortoli, E.2003. Impact of genotypic studies on mycobacterial taxonomy: the new mycobacteria of the 1990s. Clin. Microbiol. Rev.16:319-354.
  • Drancourt, M., C. Bollet, A. Carlioz, R. Martelin, J. P. Gayral, and D. Raoult.2000. 16S ribosomal DNA sequence analysis of a large collection of environmental and clinical unidentifiable bacterial isolates. J. Clin. Microbiol.38:3623-3630.
  • Pace, N. A molecular view of microbial diversity and the biosphere. Science276:734-740. 1997.

prepared by: Parvin Zarei

Nuclear magnetic resonance (NMR) technique

wo main techniques including mass spectrometry (MS) and atomic nucleus magnetic resonance, are applied in metabolic studies. Nuclear magnetic resonance (NMR) spectroscopy is a strong and non-destructive technique used to rapidly analysis of biological samples at the molecular level without the need for the separation and purification of compounds.

This technique has had a significant impact on various sciences such as biology, medicine, imaging, NMR microscopy (a variety of usages such as diamond localization to prevent breakings, the detection of microscopic defects in plastic tubes, the fruits ripening, the best conditions for food handling, and the best cooking temperature conditions), food analysis (including creamery products, vegetables, meat, oils, lipids, and beverages), physics, chemistry (chemical structure determination, in both solution and solid form), and biology.

An example:

NMR-microscopy-of-a-fresh-fruit-on-the-left-and-of-a-frozen-one-on-the-right-Note

NMR microscopy of a fresh fruit (on the left) and of a frozen one (on the right). The effect of the magnetic field B0 on the orientation of the spin magnetic moments. Nuclear magnetic resonance (NMR) spectroscopy: basic principles and phenomena, and their applications to chemistry, biology and medicine, Ioannis P et al, Chem. Educ. Res. Pract. Eur. DOI: 10.1039/B2RP90018A. 2002.

In the field of medicine, various diseases such as obesity, types of cancers, cardiovascular diseases, and celiac disease have been studied using NMR.

NMR

The advantages of NMR 

  • No requirement for the raw samples to separate analytes
  • Recycling samples after spectrometry
  • High reproducibility of data
  • High ability to identify unknown compounds
  • Tracing metabolomic pathways
  • Identification of compounds that are difficult to ionize or derivatize
  • Identification of important cellular components

The most important stages of NMR 

  • Study design
  • Sample collection/storage
  • Sample preparation
  • Spectral processing
  • Data preprocessing
  • And application of statistical analysis

    The workflow below can better illustrate the steps of NMR.

nuclear-magnetic-resonance-nmr-spectroscopy

Nuclear Magnetic Resonance (NMR) Spectroscopy in Food Science: A Comprehensive Review, Emmanuel Hatzakis, Comprehensive Reviews in Food Science and Food Safety, DOI: 10.1111/1541-4337.12408, 2019.

History and principles

NMR was discovered after World War II and at the end of the 20th century, high-resolution NMR studies of liquid and solid compounds were used dramatically for a wide range of purposes, especially in chemistry. NMR is a physical phenomenon based on quantum mechanics. In fact, in the presence of a strong magnetic field, the energy of the nuclei of certain elements is split into two or more quantized levels due to the magnetic properties of these particles. Transitions between the resulting levels of magnetic energy can be achieved by absorbing electromagnetic radiation with an appropriate frequency. The difference in energy between the quantum magnetic levels of atomic nuclei lies between 0.1 and 100 MHz. NMR is widely used for quantitative analysis and qualitative identification of very complex organic and biological compounds. In the normal state, the energy difference between the nuclear spin levels is zero, but when the atoms are placed in the presence of a magnetic field, based on the Zeeman characteristic, the degeneracy state of the system decreases. With the disappearance of the field, the atom intensifies and exhibits radiations, which are called nuclear magnetic resonance.

NMR spectroscopy is based on measuring electromagnetic radiation in the radio frequency (RF) range of about 4 to 600 MHz. So that the nucleus to find the energy states required for absorption, it is necessary to place the sample in a strong magnetic field. The primary goal of using NMR spectroscopy is to determine and recognize the structure of molecules. The information required for this work is obtained through the measurement, analysis, and interpretation of NMR spectra with high resolution.

In nuclear magnetic resonance spectroscopy; in the absence of an external magnetic field, all magnetic nuclei have equal energy. When an external field is applied, aligned and misaligned orientations will correspond to different energies. The nucleus of some atoms has a nuclear spin. In the absence of a magnetic field, all the spin states of a nucleus have the same energy level, but in the presence of a magnetic field, the spin states will not be the same. Among the important nuclei that have spin, we can mention phosphorus 31, hydrogen 1, and carbon 13.

The phenomenon of nuclear magnetic resonance occurs when the nuclei absorb energy in the direction of the applied field B۰ and changes their spin direction relative to that field. This action is called resonance.

An overview of chromatography

We decide to review the principles, classification, and applications of chromatography techniques in different sciences.

Chromatography is a major technique that provides the recognition, purification, and separation, of composition (including carbohydrates, nucleic acids, lipids, alcohol, Esther, viruses, and proteins) for biological analysis. The important principle in chromatography is that the molecules in a compound are fixed on a solid or liquid surface (coated on the surface of a solid phase) as the stationary phase (stable phase) and then separated by the motion of a liquid or gas as the mobile phase. In general, based on the type of mobile phase, there are two types of liquid chromatography (if the mobile phase is liquid) and gas chromatography (if the mobile phase is gas). Gas chromatography is used for gases and solid substances and mixtures of volatile liquids, and liquid chromatography is used for non-volatile and thermally unstable samples. The specific interaction between the mobile phase and stable phase is an efficient element and based on that, different types of chromatography have been developed, including:

  • Paper chromatography

Its other name is liquid-liquid chromatography. This type of chromatography consists of two phases, solid and liquid. The stationary phase is a layer of cellulose saturated with water. The mobile phase also consists of a fluid that is placed in a tank and rises from the cellulose paper.

  • Thin-layer chromatography

The stationary phase is an adsorbent material consisting of silica gel, alumina, or cellulose coated on a glass plate. During this method, the solvent moves from the bottom of the thin plate to the top and the analytes are separated due to the different polarities of the materials. Fluorescence, phosphorescence, and radioactivity dyes are used to better identify the position of colorless molecules in the sample in the chromatogram. By calculating the ratio between the distance traveled by the molecules and the solvent, the position of each molecule in the mixture can be obtained. This ratio, denoted by the symbol RF, is called relative mobility.

  • Gas chromatography

This method is fast, simple, and very sensitive, that is used for the detection of small amounts of analytes. The stationary phase is a liquid coated on a neutral solid, and the mobile phase is inert gases such as He and N2. The mobile phase passes through the column under the influence of high pressure. The analyzed sample is evaporated and injected into the mobile phase. At the end, sample components are distributed between mobile phase and stationary phase.

  • Gel-permeation (molecular sieve) chromatography

The primary and important principle in this method is the separation of macromolecules according to their size using materials containing Sephadeks G  (the most widely used column material), dextran, polyacrylamide, or agarose. In fact, the stationary phase behaves like a molecular sieve. Molecules larger than the size of the column pores leave the column faster, and smaller molecules are trapped inside the pores and leave the column slower. As a result, the exit speed of molecules with different sizes is different. This method is used to determine the molecular weight of proteins and reduce the concentration of protein solutions.

Gel-permeation (molecular sieve) chromatography. Separation techniques: Chromatography, Ozlem Coskun, DOI: 10.14744/nci.2016.32757. 2016

Figure 1. Gel-permeation (molecular sieve) chromatography. Separation techniques: Chromatography,  Ozlem Coskun, DOI: 10.14744/nci.2016.32757. 2016

  • Affinity chromatography

This technique is based on the specific interaction between a specific compound and the column matrix, therefore it is used to separate compounds such as hormones, enzymes, antibodies, and nucleic acids that have specific reactions. In this technique, the desired compound first binds to the column material and then leaves the column by changing the pH or adding a salt solution.

Affinity chromatography. Separation techniques: Chromatography, Ozlem Coskun, DOI: 10.14744/nci.2016.32757. 2016

Figure 2. Affinity chromatography. Separation techniques: Chromatography,  Ozlem Coskun, DOI: 10.14744/nci.2016.32757. 2016

  • Ion-exchange chromatography

This type of chromatography is based on electrostatic bonds between charged protein groups and solid matrix. The ionic charge of the matrix is ​​opposite to the charge of the protein. By changing the pH, the concentration of salt ions, or the ionic strength of the buffer, the proteins are separated from the column. Positively charged matrices are called anion exchange (due to the separation of negatively charged proteins) and negatively charged matrices are called cation exchange (due to the separation of positively charged proteins).

Ion-exchange chromatography. Separation techniques: Chromatography, Ozlem Coskun, DOI: 10.14744/nci.2016.32757. 2016

Figure 3. Ion-exchange chromatography. Separation techniques: Chromatography,  Ozlem Coskun, DOI: 10.14744/nci.2016.32757. 2016

  • Column chromatography

This method is mostly used for proteins with different sizes, shapes, bioelectricity, and binding capacity. In this method, first, the sample to be separated is placed on the column (stationary phase) and then the washing buffer (mobile phase) is passed through it. At the end, the material is collected at the bottom of the column in a way dependent on the volume.

Column chromatography. Separation techniques: Chromatography, Ozlem Coskun, DOI: 10.14744/nci.2016.32757. 2016

Figure 4. Column chromatography. Separation techniques: Chromatography,  Ozlem Coskun, DOI: 10.14744/nci.2016.32757. 2016

  • High-pressure liquid chromatography (HPLC)

The advantages of this technique are speed, high accuracy, and small sample volume, which facilitate the analysis of complex compounds. One of the main features of the device is the very compact particles of the column and the movement of the mobile phase in the column due to the application of high pressure of 10 to 400  atmospheric pressure with a high (0.1–۵ cm//sec) flow rate. Different types of biomolecules such as proteins, amino acids, steroids, nucleic acids, lipids and carbohydrates are separated and identified by this method.

  • Hydrophobic interaction chromatography

This technique is based on hydrophobic interactions between side chains attached to the chromatography matrix. Therefore, adsorbent materials are considered column materials for binding with ligands.

  • Application of chromatography in medicine

Chromatographic techniques are used in the medical field in clinical laboratories to diagnose many congenital anomalies and metabolic diseases because these techniques provide the possibility of faster and more accurate diagnosis.

References

Ozlem Coskun. Separation techniques: Chromatography. North Clin Istanb. DOI: 10.14744/nci.2016.32757; 2016

DL Pavia, GS Kriz, GM Lampman, RG Engel. A small scale approach to organic laboratory techniques. books.google.com; 2015.

Harwood LM, Moody CJ. Experimental organic chemistry: Principles and Practice. Oxford:Blackwell Science. ISBN: 0-632-04819-0; 1989

Amercham Biosciences. Ion Exchange chromatography, Principles, and methods, Amercham Pharmacia. Biotech SE. Barnes&Noble.com; 2002

Helmut D. Gel Chromatography, gel filtration, gel permeation, molecular sieves:a laboratory hand book. Springer-Verlag. books.google.com; 1969

Determann H. Gel chromatography gel filtration, gel permeation, molecular sieves:a laboratory handbook. Chapter 2. Materials and Methods. books.google.com; 2012

Wilchek M, Chaiken I. An overview of affinity chromatography in affinity chromatography–Methods and protocols. Humana Press. DOI: 10.1007/978-1-60327-261-2_1; 2000

Firer MA. Efficient elution of functional proteins in affinity chromatography. J Biochem Biophys Methods. DOI: 10.1016/S0165-022X(01)00211-1; 2001

Stoddard JM, Nguyen L, Mata-Chavez H, Nguyen K. TLC plates as a convenient platform for solvent-free reactions. Chem Commun (Camb) DOI: 10.1039/B616311D; 2007

Sherman J, Fried B, Dekker M. New York, NY: Handbook of Thin-Layer Chromatography. books.google.com; 1991

Donald PL, Lampman GM, Kritz GS, Randall G. Engel introduction to organic laboratory techniques. 4th ed. Thomson Brooks/Cole; 2006

Mahn A, Asenjo JA. Prediction of protein retention in hydrophobic interaction Chromatography. Biotechnol Adv. DOI: 10.1016/j.biotechadv.2005.04.005; 2005

Queiroz JA, Tomaz CT, Cabral JM. Hydrophobic interaction chromatography of proteins. J Biotechnol. DOI: 10.1016/S0168-1656(01)00237-1; 2001

Regnier FE. High-performance liquid chromatography of biopolimers. Science. DOI: 10.1126/science.6353575; 1983

Quantitative PCR provides a simple and accessible method for quantitative microbiota profiling

Introduction

The use of relative abundance data from next generation sequencing (NGS) can lead to misinterpretations of microbial community structures, as the increase of one taxon leads to the concurrent decrease of the other(s) in compositional data. . Since the changes of components are mutually dependent, high false discovery rates occur when compositional data are analyzed using traditional statistical methods.  Although different DNA- and cell-based methods as well as statistical approaches have been developed to overcome the compositionality problem, and the biological relevance of absolute bacterial abundances has been demonstrated, the human microbiome research has not yet adopted these methods, likely due to feasibility issues. Here, we describe how quantitative PCR (qPCR) done in parallel to NGS library preparation provides an accurate estimation of absolute taxon abundances from NGS data and hence provides an attainable solution to compositionality in high-throughput microbiome analyses. The advantages and potential challenges of the method are also discussed.

Method

۱-Bacterial DNA extraction

Bacterial DNA will be extracted from fecal samples using a modified version of repeated bead beating that efficiently extracts bacterial DNA from both Gram-positive and -negative bacteria.

۲-۱۶S rRNA gene sequencing

۳-Sequencing data processing and analysis

The preprocessing will be done in the R package mare, utilizing USERACH for quality filtering, chimera removal, and taxonomic annotation. Only the high-quality forward reads should be used.

۴-Quantitative PCR

Quantification of total bacteria, specific taxa and butyrate production capacity should be carried out by qPCR.

۵-Calculation of absolute abundance and copy-number correction

The sequencing reads assigned to different taxa in each sample will be divided by the total number of reads for the sample to obtain relative abundances of the taxa in each sample. The relative abundances obtained based on the sequencing reads will be translated into total abundances by multiplying the relative abundance of each taxon by the total bacterial abundance in the sample. These figures will be further corrected for 16S rRNA gene copy-number variation by dividing the abundance of a taxon by the number of 16S copies in its genome. For the copy-number correction, the 16S copy number database rrnDB can be used.

PCR provides

Conclusion

Importantly, qPCR-based quantitative microbiome profiling enjoys the following conceptual and practical benefits over other approaches:

۱-Cost-effectiveness and feasibility: qPCR is cost-effective and accessible as the laboratory settings, machinery and reagents are similar to those needed for preparing the NGS libraries. The same DNA extract serves as the starting material both for qPCR and NGS, making qPCR done in 96- or 384-format easy to implement in the workflow for high-throughput analysis of up to thousands of microbiome samples.

۲-Simplicity: qPCR is relatively simple to perform compared to flow cytometry that requires considerable expertise for reproducible results. In fact, flow cytometric enumeration of microbial cells was initially restricted to pure cultures and still remains challenging when performed in complex matrices [32]. Also, no spikes, other exogenous controls, or complicated transformation/computation are needed in qPCR-based quantitative microbiome profiling.

۳-Comparability to NGS: Unlike flow cytometry that counts cells, qPCR and NGS both target bacterial DNA, including extracellular DNA derived from lysed bacteria. Extracellular DNA can be intrinsic or result from the differential lysis of Gram-positive and negative bacteria during the common freeze-thawing prior to fecal DNA extraction. As the 16S profiles from the gut appear very different for intracellular and extracellular DNA [33], qPCR is expected to reflect the NGS targeted community structure both quantitatively and qualitatively more closely than flow cytometry

۴-Applicability: qPCR-based quantitative microbiome profiling is applicable also for samples containing a substantial amount of host or non-bacterial DNA, in which bacterial density cannot be reliably estimated by total DNA yield [5]. Moreover, the qPCR-based method can be employed to study also non-bacterial communities where a universal marker gene is available, such as in fungi

References

Knight R, Vrbanac A, Taylor BC, Aksenov A, Callewaert C, Debelius J, et al. Best practices for analysing microbiomes. Nature reviews Microbiology. 2018; 16(7):410–۲۲. Epub 2018/05/26. https://doi.org/10. 1038/s41579-018-0029-9 PMID: 29795328.

Morton JT, Marotz C, Washburne A, Silverman J, Zaramela LS, Edlund A, et al. Establishing microbial composition measurement standards with reference frames. Nat Commun. 2019; 10(1):2719. Epub 2019/06/22. https://doi.org/10.1038/s41467-019-10656-5 PMID: 31222023; PubMed Central PMCID: PMC6586903.

Props R, Kerckhof FM, Rubbens P, De Vrieze J, Hernandez Sanabria E, Waegeman W, et al. Absolute quantification of microbial taxon abundances. The ISME journal. 2017; 11(2):584–۷. Epub 2016/09/10. https://doi.org/10.1038/ismej.2016.117 PMID: 27612291; PubMed Central PMCID: PMC5270559.

Jian C, Luukkonen P, Yki-Järvinen H, Salonen A, Korpela K. Quantitative PCR provides a simple and accessible method for quantitative microbiota profiling. PLoS One. 2020 Jan 15; 15(1):e0227285.

AGA Clinical Practice Guidelines on the Role of Probiotics in the Management of Gastrointestinal Disorders

AGA Clinical Practice Guidelines on the Role of Probiotics in the Management of Gastrointestinal Disorders

The most accepted definition of probiotics is “live microorganisms which when administered inadequate amounts confer a health benefit on the host”. The health benefits of probiotics on gut microbiome have been previously described. The effects of probiotic can be species-, dose-, and disease-specific. Probiotics have been widely studied in a variety of gastrointestinal diseases. However, lack of clear guidelines on the most effective probiotic for different gastrointestinal conditions may be confusing.

Method

The AGA process for developing clinical practice guidelines follows the GRADE approach and best practices as outlined by the National Academy of Science.

PICO (Participants, intervention, comparison, and outcomes) format questions were identified and formulated about the use of probiotic formulations for the prevention and treatment of gastrointestinal diseases (not prebiotic use).

In the current guidelines following gastrointestinal disorders (Clostridioides difficile associated diseases, inflammatory bowel disease, irritable bowel syndrome, infectious gastroenteritis, and necrotizing enterocolitis) were considered.

 The target audience for this guideline includes healthcare providers, dieticians,   and patients. The guidelines include recommendations for specific populations including adults, children and neonates.

Recommendations

  1. In patients with C. difficile infection, we recommend the use of probiotics only in the context of a clinical trial.
  2. In adults and children on antibiotic treatment, we suggest the use of S. boulardii; or the two-strain combination of L. acidophilus CL1285 and L. casei LBC80R; or the three-strain combination of L. acidophilus, L. delbrueckii subsp. bulgaricus, and B. bifidum; or the four-strain combination of L. acidophilus, L. delbrueckii subsp. bulgaricus, B. bifidum, and S. salivarius subsp. thermophilus over no or other probiotics for prevention of C. difficile infection.
  3. In adults and children with Crohn’s disease, we recommend the use of probiotics only in the context of a clinical trial.
  4. In adults and children with ulcerative colitis, we recommend the use of probiotics only in the context of a clinical trial.
  5. In adults and children with pouchitis, we suggest the eight-strain combination of L. paracasei subsp. paracasei DSM 24733, L. plantarum DSM 24730, L. acidophilus DSM 24735, L. delbrueckii subsp. bulgaricus DSM 24734, B. longum subsp. Longum DSM 24736, B. breve DSM 24732, B. longum subsp. infantis DSM 24737, and S. salivarius subsp. thermophilus DSM 24731 over no or other probiotics.
  6. In symptomatic children and adults with irritable bowel syndrome, we recommend the use of probiotics only in the context of a clinical trial.
  7. In children with acute infectious gastroenteritis, we suggest against the use of probiotics.
  8. In preterm (less than 37 weeks GA), low birth weight infants, we suggest using a combination of Lactobacillus spp. and Bifidobacterium spp. (L. rhamnosus ATCC 53103 and B. longum subsp. infantis; or L. casei and B. breve; or L. rhamnosus, L. acidophilus, L. casei, B. longum subsp. infantis, B. bifidum, and B. longum subsp. longum; or L. acidophilus and B. longum subsp. infantis; or L. acidophilus and B. bifidum; or L. rhamnosus ATCC 53103 and B. longum Reuter ATCC BAA-999; or L. acidophilus, B. bifidum, B. animalis subsp. lactis, and B. longum subsp. longum), or B. animalis subsp. lactis (including DSM 15954), or L. reuteri (DSM 17938 or ATCC 55730), or L. rhamnosus (ATCC 53103 or ATC A07FA or LCR 35) for prevention of NEC over no and other probiotics.

Key Words

Probiotics, Gastrointestinal Disorders, Guideline

Reference

Su GL, Ko CW, Bercik P, Falck-Ytter Y, Sultan S, Weizman AV, Morgan RL. AGA Clinical Practice Guidelines on the Role of Probiotics in the Management of Gastrointestinal Disorders. Gastroenterology. 2020 Aug;159(2):697-705. doi: ۱۰.۱۰۵۳/j.gastro.2020.05.059.

Current challenges and best-practice protocols for microbiome analysis

Analyzing the microbiome of diverse species and environments using next-generation sequencing techniques has significantly enhanced our understanding on metabolic, physiological and ecological roles of environmental microorganisms. However, the analysis of the microbiome is affected by experimental conditions (e.g. sequencing errors and genomic repeats) and computationally intensive and cumbersome downstream analysis (e.g. quality control, assembly, binning and statistical analyses). Moreover, the introduction of new sequencing technologies and protocols led to a flood of
new methodologies, which also have an immediate effect on the results of the analyses. The aim of this work is to review the most important workflows for 16S rRNA sequencing and shotgun and long-read metagenomics, as well as to provide best-practice protocols on experimental design, sample processing, sequencing, assembly, binning, annotation and visualization. To simplify and standardize the computational analysis, we provide a set of best-practice workflows for 16S rRNA and metagenomic sequencing data (available at https://github.com/grimmlab/MicrobiomeBestPracticeReview).

The methods for gut microbiota analysis

Both target gene and metagenomic sequencing approaches are key to decipher a plethora of roles which are played by environmental microorganisms. However, both sequencing and computational methods still suffer from many biases that are due to errors in sample handling, experimental errors
and downstream bioinformatics analysis. Thus, improvements in sequencing technologies and the development of new computational tools and algorithms should always be based on prior knowledge, e.g. known caveats at each sample processing step. Factors that potentially influence preprocessing, as well as downstream analysis of both short-read and long-read data including sample preparation, sequencing, binning, assembly and functional annotations, should be catalogued precisely.
Herein, we have attempted to list challenges and best-practice protocols utilized during microbiome acquisition using 16SrRNA and metagenomic sequencing. This is important due to the large and expanding paradigms of computational tools that have been developed in recent years for analyzing long and short-read sequencing data. Here, we provide a workflow of optimally tested tools available for processing sequencing samples, estimating microbial abundances, and classification, assembly and functional annotations. In addition, we also discussed the experimental challenges with a systematic review of steps involved in 16S rRNA and shotgun metagenomics.
The experimental challenges mainly account for factors responsible for contamination in isolated microbial genomes and resulting variations in microbial profiles. Although gradual improvisation of these factors has been implemented, extensive and multilayered, sequencing data remain prone to errors at various levels. Hence, we believe that utilization and awareness of integrated methods described here will not just help to improve the reliability of sequencing outcomes but would also reduce variability in the data generation and processing steps.

Key words

microbiome; amplicon sequencing; 16S rRNA sequencing; metagenomics

Reference

Bharti R, Grimm DG. Current challenges and best-practice protocols for microbiome analysis. Briefings in bioinformatics. 2021 Jan;22(1):178-93. doi: 10.1093/bib/bbz155

Guidelines for quality control of NGS techniques

Next-generation sequencing (NGS) refers to large-scale, fast and efficient DNA (and RNA) sequencing technology. NGS is changing the paradigm in precision medicine and continue to fuel innovation.

Data-Driven NGS Quality Control Guidelines

The data-driven guidelines detailed below for the quality control of next-generation sequencing (NGS) files were generated by comparing 47 quality features on 2000+ FastQ files manually labelled for quality. Guidelines have been generated for specific organisms and assays, and also for experimental conditions related to particular cell types or ChIP protein and antibody targets. Focus is given to the understanding of individual quality features and their effective combination.

Guideline Documents

  • Scientific publication (link to article): detailed motivations, methods, results and discussion.
  • Decision trees (link to PDF): methods summary and decision trees to classify NGS files by quality in a selection of data subsets
  • Interactive tables (below on this page): compare classification performance of the quality features in a selection of data subsets
  • Online interactive dashboard (external web site): compare values of the quality features in user-defined data subsets, including statistical test results on selected subsets

Reference

Sprang M, Krüger M, Andrade-Navarro MA, Fontaine JF. Statistical guidelines for quality control of next-generation sequencing techniques. Life science alliance. 2021 Nov 1; 4(11).

Danish national guideline for the treatment of Clostridioides difficile infection and use of fecal microbiota transplantation (FMT)

Clostridioides (formerly Clostridium) difficile (CD) infection (CDI) is a major cause of nosocomial diarrhea and accounts for 20–۳۰% of cases of antibiotic-associated diarrhea. The disease poses a persistent health threat, is associated with a high mortality and generates considerable hospital costs.

Fecal microbiota transplantation (FMT) is the transfer of minimally processed faeces from a healthy donor to a patient in order to treat disease. The method has been used in modern medical science since 1958. Its clinical effect in recurrent CDI (rCDI) has been documented in observational and randomized studies. The use of FMT in the treatment of other conditions is being explored in clinical trials. In the future, the use of microbiota-based drugs may potentially replace or supplement FMT. The basis for this clinical guideline is the use of FMT in patients with CDI. Experimental treatments and indications for FMT are briefly discussed.

Method

The formation of this guideline followed the preform for clinical guidelines, including representation in the working group by specialists, doctors in training, university hospitals, regional hospitals, and all geographic regions of Denmark. The process and the final guideline were endorsed by the Danish Society for Gastroenterology and Hepatology, the Danish Society of Infectious Diseases, the Danish Society for Clinical Microbiology, and the Danish Immunology Society for Clinical Immunology, following a hearing process in each scientific society. Each scientific society appointed at least two working group members.

Results

 In CD infection, the use of marketed and experimental antibiotics as well as microbiota-based therapies including FMT are described. An algorithm for evaluating treatment effect is suggested. The organization of FMT, donor recruitment and screening, laboratory preparation, clinical application and follow-up are described.

Conclusion

 In this Danish national guideline, updated evidence for the treatment of CD infection and the use of FMT is provided.

Key Words

FMT, CDI, Treatment, Guideline

Reference

Baunwall SM, Dahlerup JF, Engberg JH, Erikstrup C, Helms M, Juel MA, Kjeldsen J, Nielsen HL, Nilsson AC, Rode AA, Vinter-Jensen L. Danish national guideline for the treatment of Clostridioides difficile infection and use of faecal microbiota transplantation (FMT). Scandinavian Journal of Gastroenterology. 2021 Sep 2; 56(9):1056-77.